Your resort’s website analytics tell you how many people visited your ticket purchase page. Microsoft Clarity shows you what those people actually did when they got there — where they clicked, where they stopped scrolling, where they rage-clicked in frustration, and where they gave up and left. It’s free, it takes 10 minutes to install, and it will show you revenue-blocking UX problems you didn’t know existed.

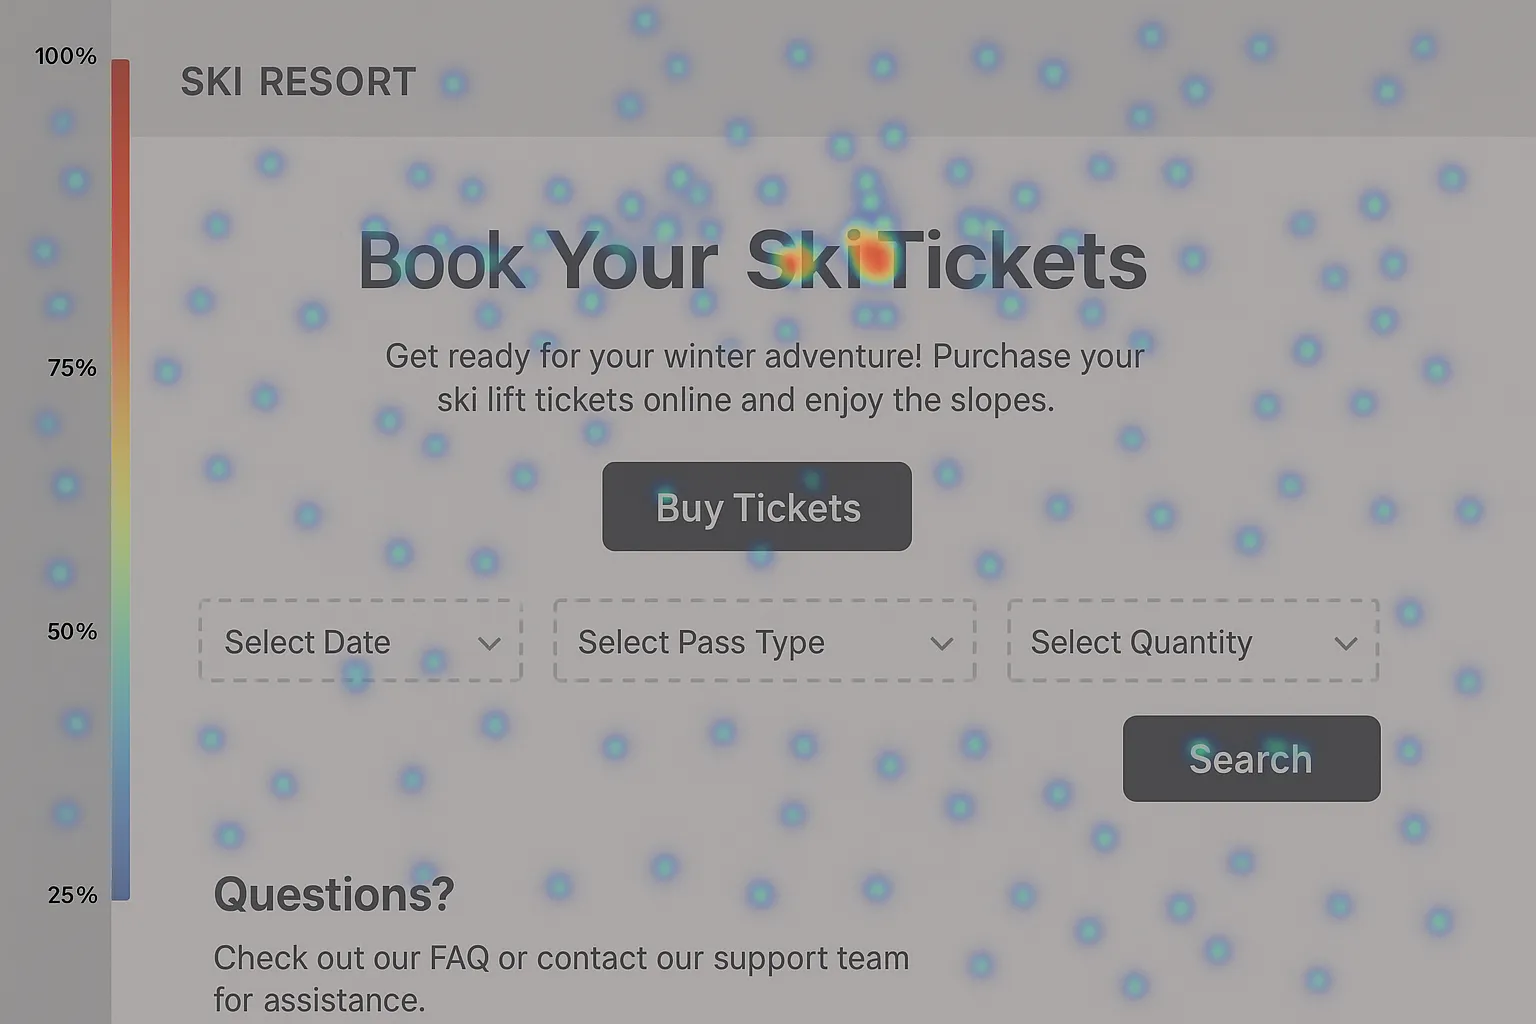
Clarity heatmaps reveal exactly where guests engage — and where they abandon.
Free Heatmaps That Show You What’s Actually Happening
Clarity’s heatmaps aggregate behavior from every session into a single visual — red zones are where users click most, blue zones are where they don’t scroll. For ski resorts, the most common revelation is that guests are clicking on non-clickable elements (a photo of a trail they expect to link somewhere, a price that looks interactive but isn’t), which signals a UX mismatch between what you built and what guests expect. Scroll heatmaps consistently show that most visitors never see your CTA if it’s placed below the fold on mobile.
Set Up in 10 Minutes on AI-powered WordPress plugins for ski resorts
Go to clarity.microsoft.com, create a free project, and copy your tracking script. In WordPress, paste it via a header plugin like Insert Headers and Footers, or directly into your theme’s header.php if you’re comfortable with code. Clarity starts collecting session recordings and heatmap data immediately — no configuration required beyond the initial install. Within 48 hours you’ll have enough data to identify your top issues. There’s no usage cap and no paid tier required.
What to Look for on Your Ticket Page
Start with your lift ticket purchase page and look for three specific signals: rage clicks (rapid repeated clicks indicating frustration — usually a broken button or slow load), dead clicks (clicks on elements that don’t respond, suggesting guests expect interactivity), and excessive scrolling before any engagement. On mobile, check whether guests can find your “Buy Tickets” button without scrolling. If your mobile conversion rate is significantly below desktop, Clarity’s session recordings will show you exactly why within the first 10 recordings you watch.

Session recordings let you watch real guest journeys through your checkout — anonymized and GDPR-compliant.

Three quick wins from Clarity can meaningfully lift your ticket page conversion rate.
Three Wins You Can Act on Today
First, watch 10 session recordings of guests who visited your ticket page but didn’t purchase — you’ll spot the friction point within the first three. Second, check your heatmap for mobile vs. desktop scroll depth on your homepage — if your main CTA isn’t visible above the fold on mobile, move it up. Third, look for rage-click zones and fix whatever’s causing them: a slow-loading widget, a broken link, or a price display that looks like a button. These three fixes typically take under a day to implement and can recover 10–15% of abandoned sessions.